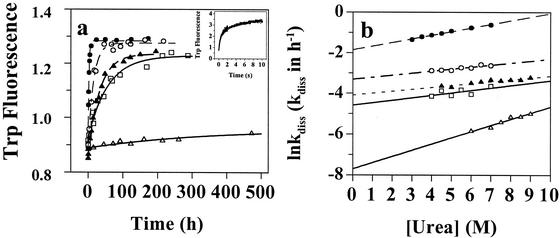
Figure 3.
TTR tetramer dissociation rates as a function of urea concentration (Fig. 2 symbols apply). (a) Unfolding time course measured by tryptophan fluorescence provides the rate of TTR tetramer dissociation in 6.0 M urea. Inset shows the rapid unfolding of monomeric TTR in 5.0 M urea measured by stopped-flow fluorescence. (b) The logarithm of the rate of tetramer dissociation, lnkdiss (kdiss in h−1) plotted as a function of urea concentration. The lnkdiss vs. urea concentration plot is linear, allowing extrapolation to 0 M urea.

