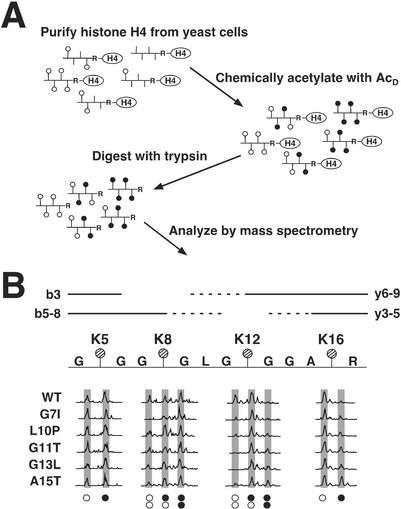
Figure 4.
Mass spectrometric analysis to measure acetylation at specific lysine residues in the histone H4 tail. (A) A schematic of the method used to determine site-specific acetylation of histone H4. Vertical lines represent lysines that can be acetylated, ○ represents those lysine residues acetylated in vivo (AcH), and ● represents lysine residues chemically acetylated by deuterated acetic anhydride in vitro (AcD); the mass difference between ○ and ● is 3 Da (42 versus 45, respectively). Tryptic digestion of purified and chemically modified histones produced a chemically identical population of tail peptides containing K5, K8, K12, and K16, beginning at G4 and terminating at R17. These peptides were then analyzed by MS. (B) Mass spectra showing altered levels of protonated versus deuterated acetylation in mutant and wild-type histone H4. A schematic of the histone H4 tryptic peptide is shown with each of the four lysine residues marked with a hatched circle. The lines (solid and dashed) above the peptide represent b and y ions. The b3 ion provided acetylation information for K5 and b ions 5-8 (b5–8) provided information for K8; similarly, y ions 3–5 (y3–5) were used to assess acetylation at K16 and y ions 6–9 (y6–9) were used for K12. (The b4 and y2 ions were indistinguishable in the spectra and were therefore omitted from analysis; the mass of the b2 ion was below the detection range.) Spectra of various b and y ions are shown for wild-type histone H4 along with mutants G7I, L10P, G11T, G13L, and A15T. The x axis and y axis of the mass spectra represent mass-to-charge ratio and relative abundance, respectively. Peaks are highlighted by shaded boxes and are aligned above symbols denoting whether the lysines are acetylated with a protonated (○) or deuterated (●) acetyl. ○○ represents fragment ions containing two lysine residues that are both modified with protonated acetyls; ○● represents fragments with one protonated and one deuterated acetyl; ●● represents fragments in which both acetyls are deuterated.

