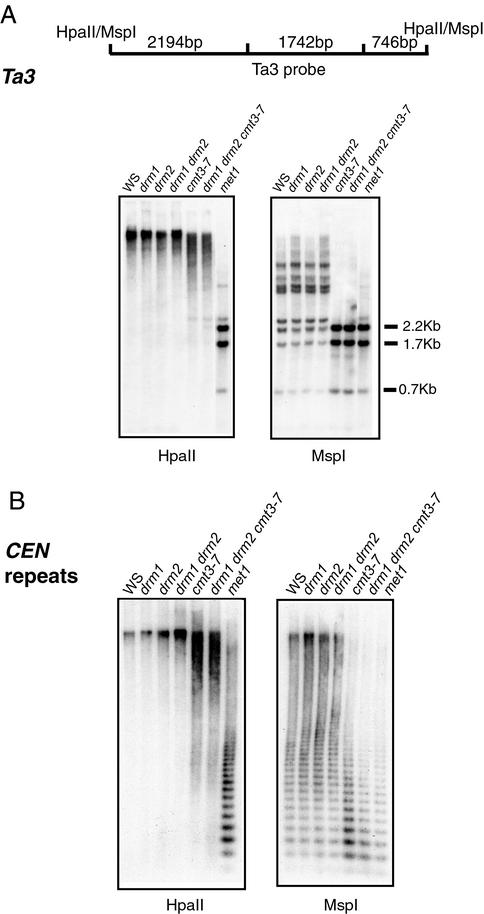
Figure 3.
Southern blot analysis of the Ta3 retrotransposon and 180-bp centromeric repeat sequences. Each panel shows lanes that contain equivalent amounts of genomic DNA of the indicated genotype digested with HpaII (Left) and MspI (Right). (A Upper) A diagram of the HpaII/MspI restriction fragments present in the Ta3 probe. (Lower) A DNA blot probed with Ta3 probe. (B) Blot probed with a 180-bp centromeric repeat probe.

