Figure 4.
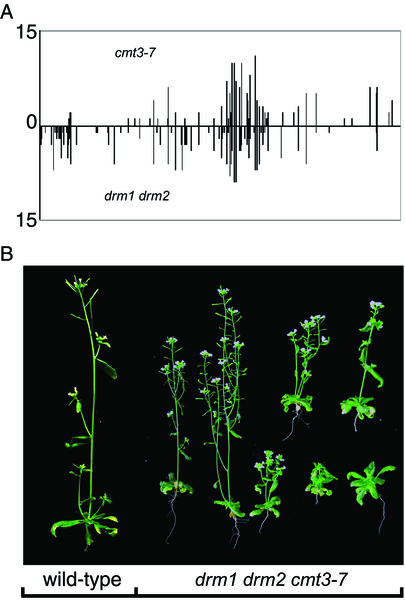
Genetic redundancy of the DRM and CMT3 genes. (A) Graph showing the level and positions of asymmetric methylation of SUP in the cmt3-7 mutant or the drm1 drm2 double mutant, both in the clk-st background. Height of the bars represents the frequency of methylation at each site of 15 clones analyzed by bisulfite sequencing. The x axis represents the 1,028-nt methylated region on the top strand of SUP. (B) Photographs of a four-week-old wild-type Ler plant (Left) and several drm1 drm2 cmt3-7 triple mutant plants (Right).

