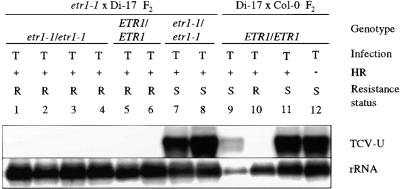
Figure 8.
Systemic Spread of TCV in etr1-1 × Di-17 F2 Plants.
F2 plants from an etr1-1 × Di-17 or a Di-17 × Col-0 cross were inoculated with TCV (T) and scored for the presence (+) or absence (−) of an HR. The genotype at the ETR1 locus was determined by CAPS analysis. The plants were scored as resistant (R) or susceptible (S) at 14 DPI, based on the absence or presence of disease symptoms, respectively. RNA was extracted from the uninoculated bolt tissues (TCV-U) at 14 DPI and analyzed for the presence of viral genome (1 to 12). This blot also was probed for rRNA as an internal control for gel loading and transfer.

