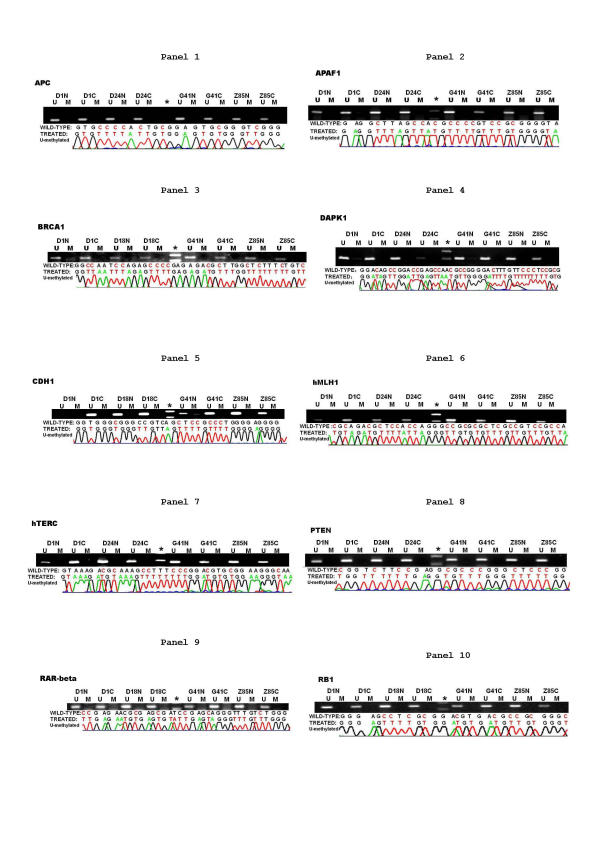
Figure 2.
The methylation profiles of ten genes in human HCC patients (part 2). Both electrophoretic patterns of the representative PCR products of ten targets (indicated respectively at the top of figures) and the corresponding sequencing result of the one representative PCR product were presented. To indicate the methylation status, the sequenced data are aligned with the wild-type sequence. Representative samples are presented. * size marker. U, the unmethylated; and M, the methylated.

