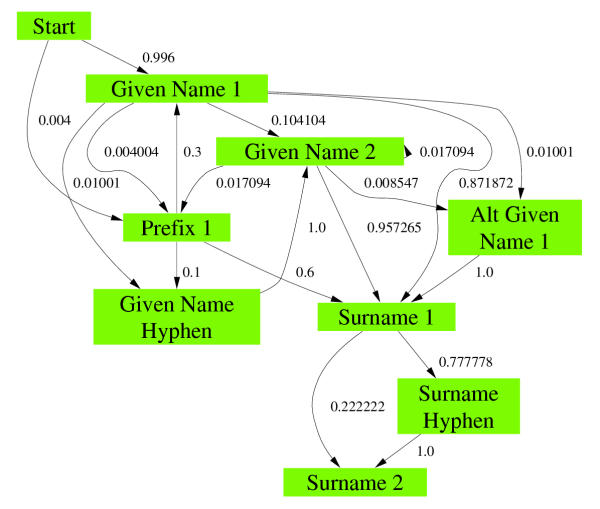
Figure 2.
Graph of the name standardisation HMM evaluated in this study Rectangular nodes denote hidden states. Numbers indicate the probabilities of transitions between states, represented by the edges (arrowed lines). States which were not used and transitions which had a zero probability in the evaluation have been suppressed in the interests of clarity. Prepared with the Graphviz tool http://www.research.att.com/sw/tools/graphviz/.

