
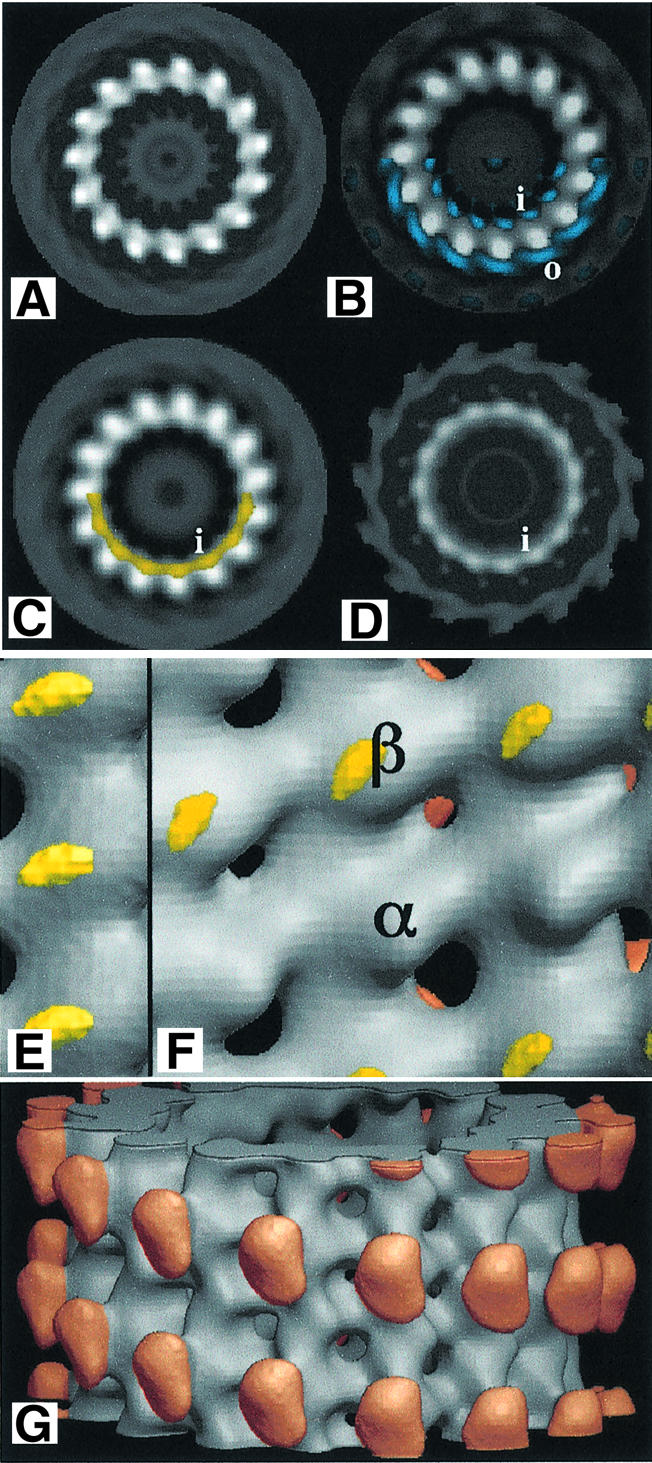
Fig. 7. Reconstructed images. (A–D) End-on views of microtubules without kinesin. (A) Pure tubulin (with GMPCPP). (B) Tubulin co-assembled with unlabelled tau. Tau difference density (at a lower cut-off level) is superimposed in blue on half of the map; some density appears on the inner (i) and outer (o) surfaces. (C) Tubulin co-assembled with labelled tau. The peak of the difference density due only to nanogold is superimposed in yellow. (D) Complete nanogold difference map [(C) minus (B)]. (E and F) Inside views of three- dimensional maps. (E) Three-dimensional version of (C). (F) As--sembled with labelled tau and decorated outside with kinesin (red). Peaks of the density difference between maps of kinesin-decorated microtubules containing labelled tau and without tau, are shown in yellow. (G) Outside view of kinesin-decorated microtubule assembled with gold-labelled tau. The difference map shows no density here at the level depicted in (F).