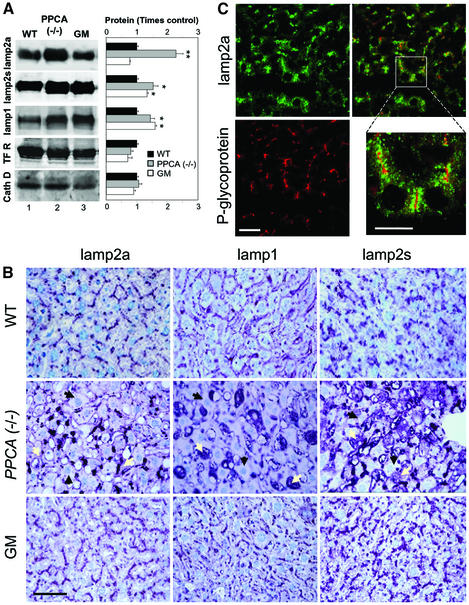
Fig. 4. Lamps levels in livers from PPCA(–/–) mice. (A) Immunoblot analysis for lamp2a, all lamp2s, lamp1, transferrin receptor (TFR) or cathepsin D (cath D) of liver homogenates (100 µg of protein) from wild-type (WT), PPCA(–/–) and β-galactosidase(–/–) (GM) mice. Right: densitometric quantification of three immunoblots (means + SE) similar to the ones shown here. Differences from the control value were significant to P < 0.001 (**) and P < 0.05 (*). (B) Immunocytochemistry for lamp2a (left), lamp1 (center) or lamp2s (right) in hematoxylin and eosin-stained sections from the same livers. Bar: 50 µm. Black arrows: hepatocytes; white arrows: Kupffer cells. (C) Immunofluorescence for lamp2a (top) and P-glycoprotein (bottom) in mouse liver sections. The right panel shows merged images. Bar: 100 µm. Inset shows detailed area at higher magnification. Bar: 50 µm.

An official website of the United States government
Here's how you know
Official websites use .gov
A
.gov website belongs to an official
government organization in the United States.
Secure .gov websites use HTTPS
A lock (
) or https:// means you've safely
connected to the .gov website. Share sensitive
information only on official, secure websites.
