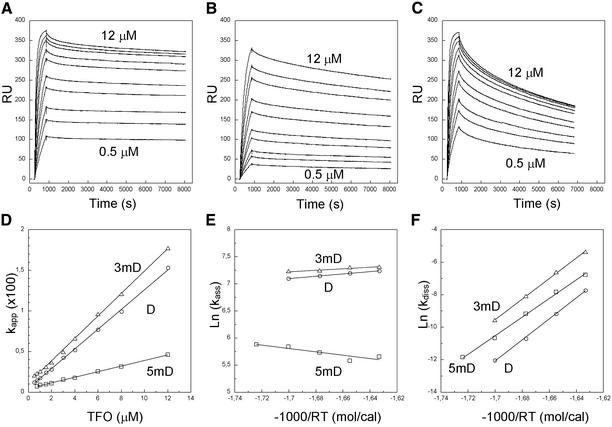
Figure 2.
Corrected SPR sensorgrams of the D, 5mD and 3mD triplexes (A–C, respectively) at different TFO concentrations (0.5, 0.75, 1, 1.5, 2, 3, 4, 6, 8, 12 µM from bottom to top) at 23°C. The apparent association rate constants (kapp) are plotted versus TFO concentration and analyzed by linear regression (D). Also shown are the Arrhenius plots of the association and dissociation rate constants (kass and kdiss) (E and F, respectively). Triplexes D, 5mD and 3mD are indicated by circles, squares and triangles, respectively.

