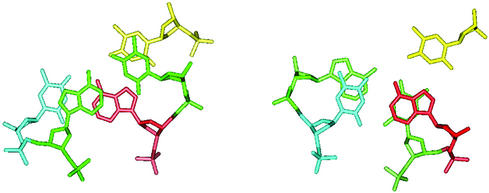
Figure 5.
Structure of the duplex–triplex junction from a previously published energy minimized model (32). The nucleotides involved in the base triplet are colored in blue, red and yellow for Watson–Crick base pair and TFO, respectively. The Watson–Crick base pair next to the junction is colored in green. The 5′ axis of the oligopurine strand comes out of the plan. The 5′ and the 3′ junctions are shown on the left and right, respectively. Hydrogen atoms are omitted for clarity.

