
Figure 7.
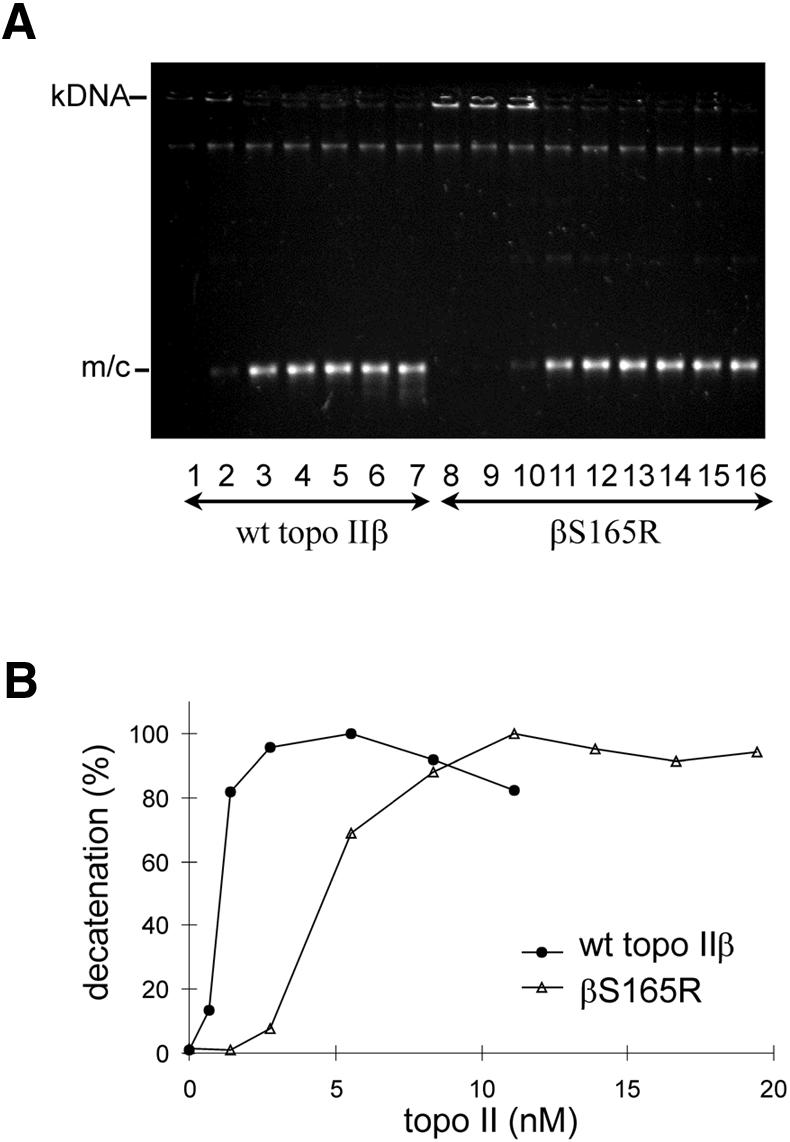
βS165R has reduced decatenation ability compared to wt topo IIβ. Topo II was incubated with 400 ng kinetoplast DNA (kDNA) in the presence of ATP at 37°C for 30 min. (A) Minicircles released by topo II activity are indicated (m/c). Lanes 1–7: 0, 0.7, 1.4, 2.8, 5.6, 8.3 and 11.1 nM wt topo IIβ; lanes 8–16: 0, 1.4, 2.8, 5.6, 8.3, 11.1, 13.9, 16.7 and 19.4 nM βS165R. These data are plotted as percentage decatenation against concentration of wt topo IIβ (filled circles) and βS165R (open triangles) in (B).