
Figure 1.
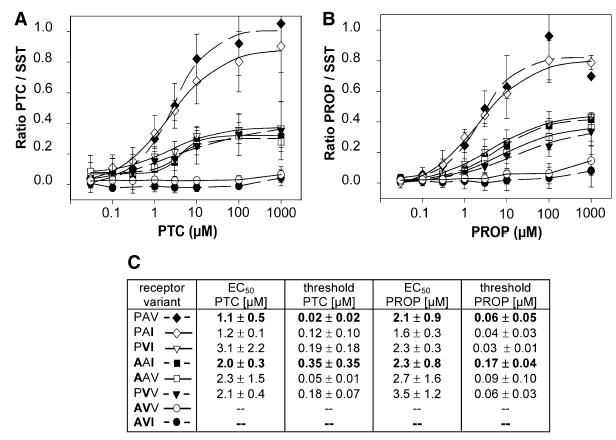
Dose-Response Curves of the Calcium Concentrations in Cells Cotransfected with hTAS2R38 Variants after Stimulation with Increasing PTC and PROP Concentrations
(A) Effects of a PTC concentration series on cells expressing the TAS2R38 variants (descending order): PAV (dashed line), PAI (solid line), PVI (solid line), AAI (dashed line), AAV (solid line), PVV (dashed line), AVV (solid line), or AVI (dashed line). See (C) for symbols key. The amplitudes of PTC (A) and PROP (B) responses have been normalized to those of the peptide hormone somatostatin-14 SST (1 μM), which activates an endogenous receptor. All receptor variants were challenged with PROP and PTC up to 1 mM, at which point PAV responses saturated. Each point represents the mean ± the standard error of the mean of at least three independent experiments carried out in triplicate. See Supplemental Experimental Procedures for methods, and for additional detail see Bufe et al., 2002 [9].
(B) Effects of a PROP concentration series on cells expressing the eight TAS2R38 variants. Symbols are as above.
(C) Half maximal response (EC50) and threshold values of all receptor variants for PROP and PTC. Amino acids identical to those of the AVI variant are listed in bold in the three-letter haplotype name to the left. Responses were normalized to somatostatin responses. EC50 and threshold numerical values for the three haplotypes tested from subjects PAV, AAI, AVI are in bold.