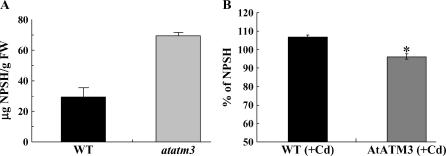
Figure 7.
NPSH levels in wild-type, atatm3 mutant, and AtATM3-overexpressing plants. A, NPSH in 1-week-old wild-type and atatm3 mutant seedlings. B, Relative levels of NPSH in 2-week-old wild-type and AtATM3-overexpressing plants compared to NPSH level of non-Cd-treated wild type, determined as described in “Materials and Methods.”

