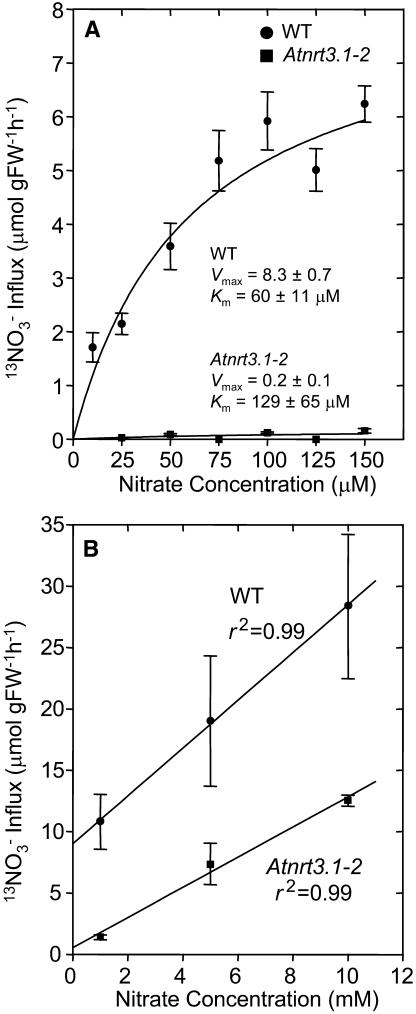
Figure 5.
13NO3− influx into wild-type and Atnrt3.1-2 mutant roots. A, High-affinity 13NO3− influx. Plants were grown for 4 weeks in 1 mm NH4NO3 and then nitrogen deprived for 1 week before being reexposed to 1 mm KNO3 for 6 h. Nitrate influx was then measured at 10, 25, 50, 75, 100, 125, and 150 μm NO3− as described in “Materials and Methods.” Data values are means ± se of five replicates. The fitted curve was obtained by direct fit to the Michaelis-Menten equation. Estimated Km and Vmax values are indicated in the figure. B, Low-affinity 13NO3− influx. Plants were grown for 4 weeks in 1 mm NH4NO3 and then nitrogen deprived for 1 week before being reexposed to 1 mm KNO3 for 6 h. Nitrate influx was then measured at 1, 5, and 10 mm NO3−. Data values are means ± se of four replicates.

