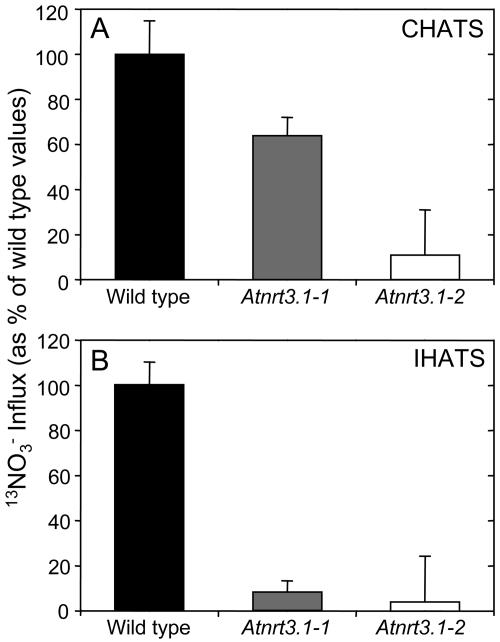
Figure 6.
13NO3− influx by CHATS and IHATS. A, 13NO3− influx due to CHATS in wild-type and Atnrt3.1 mutants as percentages of wild-type fluxes. Plants were grown for 4 weeks in 1 mm NH4NO3 and then nitrogen deprived for 1 week. Nitrate influx was then measured at 100 μm NO3−. B, 13NO3− influx due to IHATS in wild-type and Atnrt3.1 mutants as percentages of wild-type fluxes. Plants were grown for 4 weeks in 1 mm NH4NO3 and then nitrogen deprived for 1 week before being reexposed to 1 mm KNO3 for 6 h. Nitrate influx was then measured at 100 μm NO3−. IHATS influxes were calculated by subtracting the measured CHATS flux from the flux measured after induction. Data values are means ± se of four replicates.

