Fig. 1.
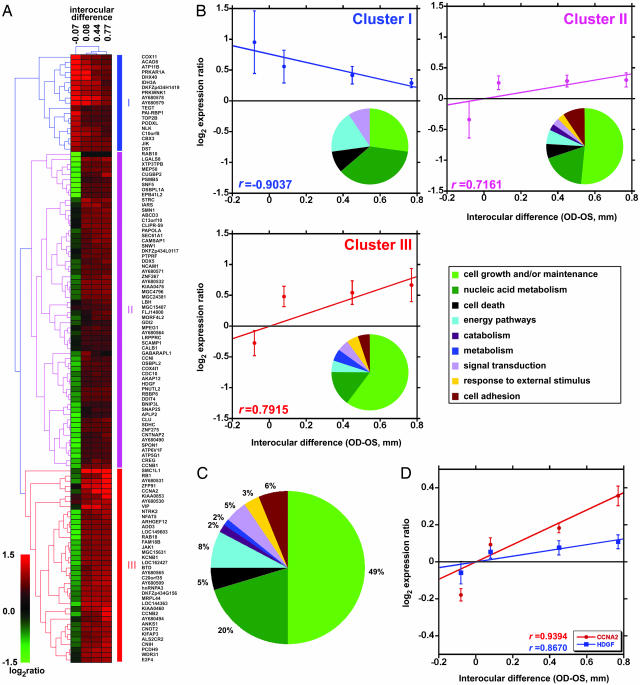
Gene expression analysis indicates that lid fusion caused increased cell proliferation in the retina. (A) Hierarchical cluster analysis of genes differentially regulated in the retina of the closed eye vs. the retina of the open eye. Interocular differences in depths of the vitreous chamber [right (closed) eye (OD)–left (open) eye (OS) in millimeters] are shown above the clusters. The two monkeys in which closure caused axial elongation (nos. 185-03 and P047) and the control monkey (No. 151-03) were clustered together, whereas the monkey in which closure caused a small decrease in vitreous length (No. P049) exhibited a different expression profile. Red represents genes that are up-regulated, and green represents genes that are down-regulated. Genes can be divided into two groups: a first group of 19 (cluster I) negatively correlated and a second group of 100 (clusters II and III) positively correlated with the depth of the vitreous chamber. The pie charts show the distribution of the differentially regulated genes according to the gene ontology terms for biological function in each cluster (B) and in all clusters combined (C). (D) Real-time PCR confirmed that expression of the genes for CCNA2 (cluster III) and HDGF (cluster II) was highly correlated with the axial dimension of the vitreous chamber.

