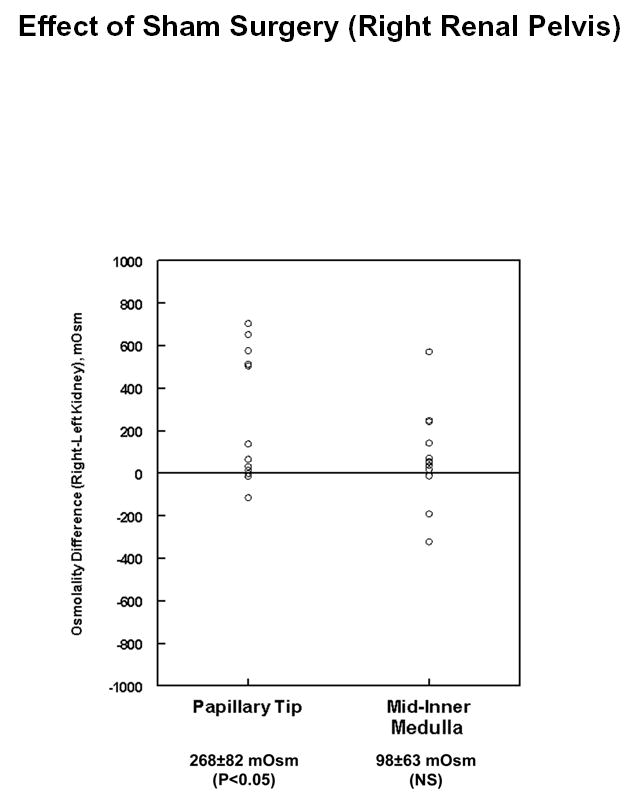
Figure 3.

Difference in total solute concentration (osmolality) in sham (right) vs. control (left) inner medullas after sham surgery of right renal pelvis. Kidneys were resected one hour after sham surgery and analyzed as described in Methods. Total number of hamsters = 13.
