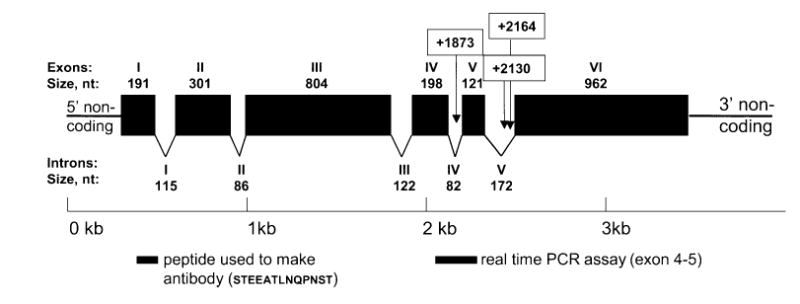
Figure 3.

Intron–exon structure of the rat Tas1r3 gene. Above the gene structure, exons are labeled in Roman numerals, with their size (in nucleotides) shown underneath. Below the gene structure, introns are labeled in Roman numerals, and their size is shown underneath. The nucleotide positions are numbered such that the first nucleotide of the putative methionine initiation codon is +1. Polymorphisms are denoted by the changed nucleotide position and are shown in open boxes. Intron and exon structure was determined by aligning cDNA with genomic DNA. Filled boxes underneath the gene structure show the locations of the real time PCR probe and the peptide used to produce the antibody.
