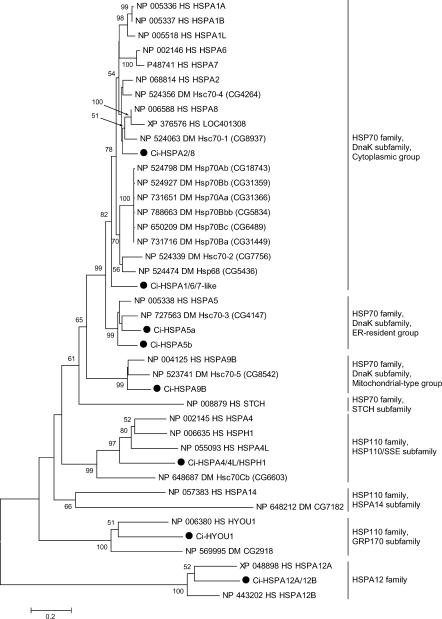
Fig 1.
Phylogenetic tree of HSP70 superfamily proteins constructed based on the full-length sequences of HSP70 superfamily proteins of humans, C intestinalis, and D melanogaster. Ciona proteins are indicated by large black dots. The number at each branch indicates the percentage of times that a node was supported in 1000 bootstrap pseudoreplications. Percentages <49% are omitted for simplicity. Proteins are named as explained in Materials and Methods. The unrooted tree is shown as a rooted tree for simplicity. The scale bar indicates an evolutionary distance of 0.2 amino acid substitutions per position. Bars on the right indicate gene groups. As for members of cytoplasmic group of DnaK subfamily, another tree was constructed to know the relationship among them more precisely (supplementary Fig S1)

