
Figure 3.
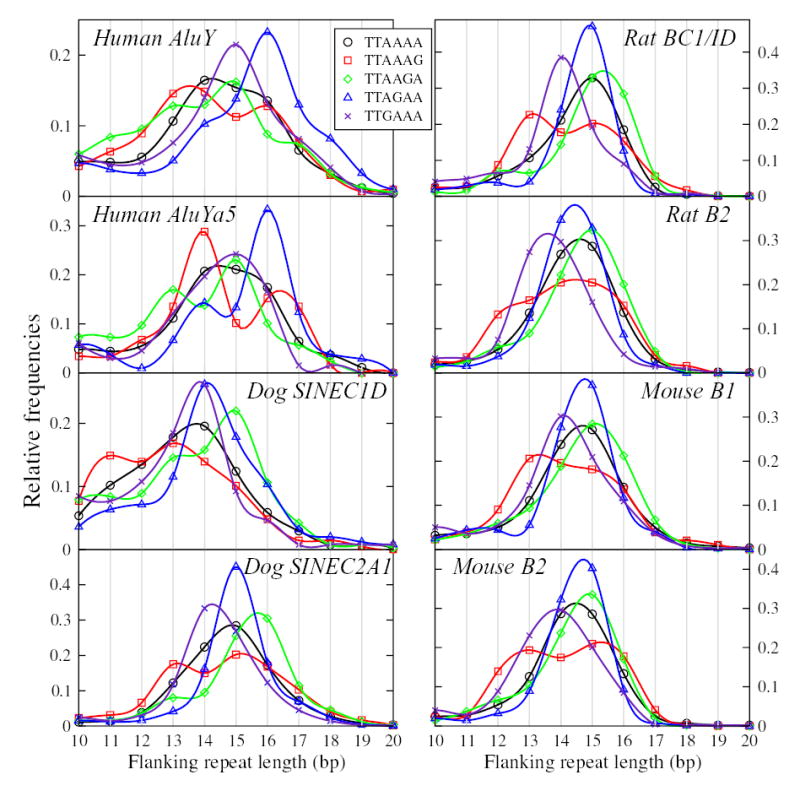
Distribution of lengths of flanking repeats for TT-AAAA targets, and variants involving a single A→G change (the most common target types observed). In each panel, the horizontal axis shows flanking repeat length, while the vertical axis shows relative frequency. The plots have been smoothed to facilitate visual comparisons. Significance of differences between distributions (evaluated by Kolmogorov-Smirnov tests) is tabulated in Tables 1 and 2, and in supplementary table S1, as discussed in the text.