
Figure 4.
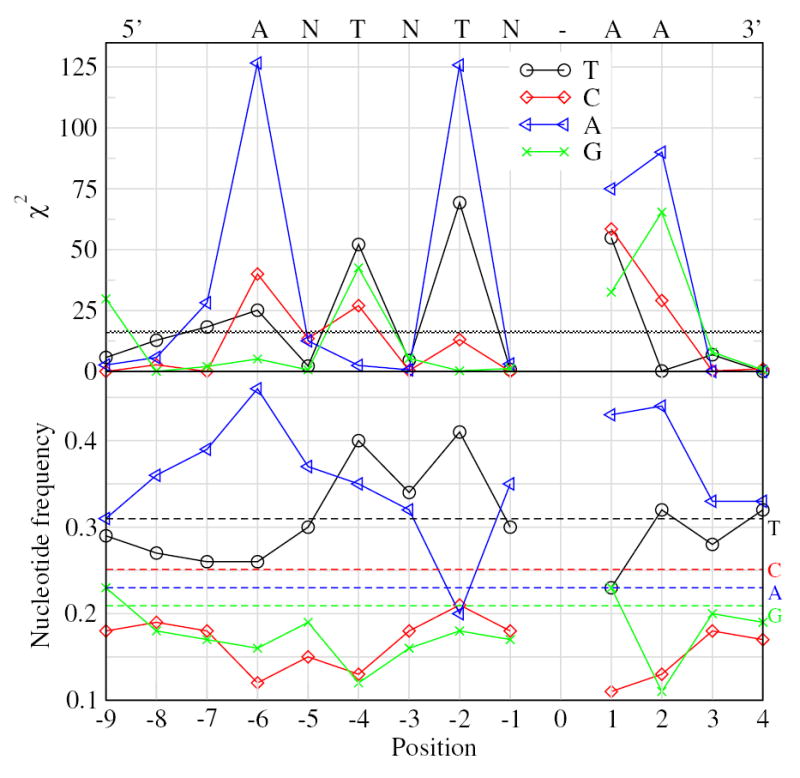
Determination of the consensus sequence for the second endonucleolytic nicking sequence. The top panel shows χ2 values at the indicated positions relative to the nicking site (see Jurka, 1997 for detailed description of methodology). χ2 values above the horizontal graded line at χ2=16.27 are significant at the p=0.001 level. Nucleotide composition at each position relative to the predicted nicking site is shown in the bottom panel. At positions −1, −3, and −5, no nucleotide is significantly over-represented (“N”). At positions +1, +2, and −6 “A” is unambiguous. “T” has the highest χ2 at positions −2 and −4. Horizontal lines in the bottom panel show the mean composition of the 3′ flanking regions of the elements studied, identified by nucleotide letter on the right-side axis.