
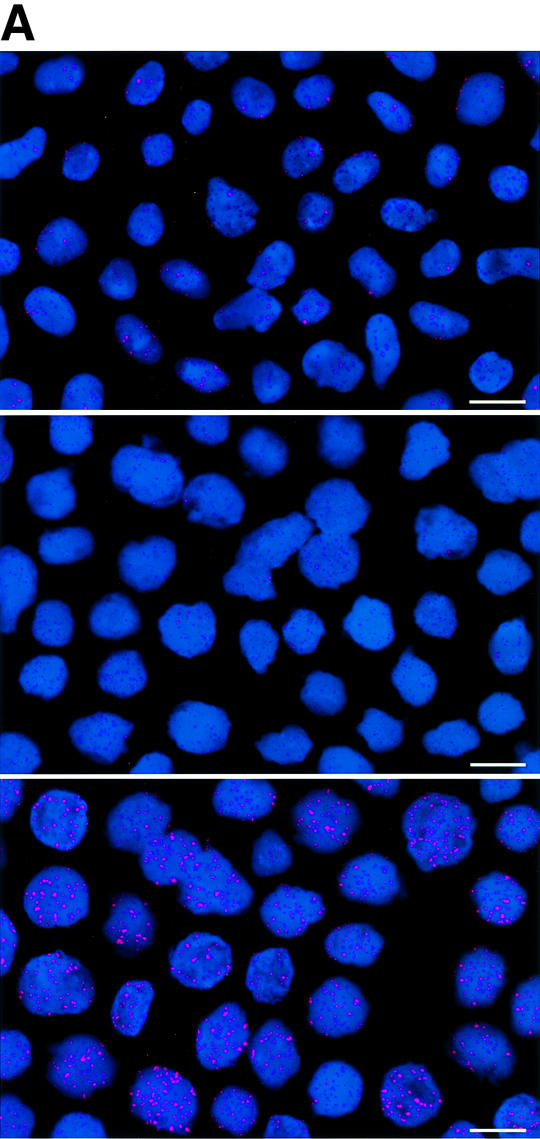


Fig. 1. Telomere length analysis of WT and Terc–/– cardiac myocytes. (A) Representative confocal microscopy image showing FITC–PNA telomeric fluorescence on isolated nuclei (see Materials and methods). Cardiomyocyte nuclei were obtained from a G5 Terc–/– mouse (top panel). Lymphoma cells with short telomeres (L5178Y-S cells, 7 kbp; middle panel) and lymphoma cells with long telomeres (L5178Y cells, 48 kbp; bottom panel) are shown for comparison (McIlrath et al., 2001). Nuclei are illustrated by the blue fluorescence of propidium iodide (PI), and the red fluorescent dots correspond to telomeres. Bar = 10 µm. (B and C) Telomere fluorescence frequency histograms of WT, G2 and G5 Terc–/– cardiomyocytes derived from either young (2–4 months old, B) or older (6–8 months old, C) mice after Q-FISH with a Cy3-labeled telomere-specific probe (Materials and methods). Telomere length is shown as a.u.f. Three mice of each genotype were used for the analysis. The total numbers of nuclei and telomere dots used for the analysis are also indicated. Average telomere fluorescence values for each genotype expressed as a.u.f. are also shown together with the corresponding standard deviation. Note a higher frequency of nuclei with shorter telomeres in the G2 Terc–/– cardiac myocytes compared with the corresponding wild-types. This frequency is increased further in G5 Terc–/– cardiac myocytes. Statistical significance calculations are also shown. (D) Comparison of relative telomere fluorescence in young (2–4 months old) and aged (6–8 months old) G5 Terc–/– cardiac myocytes (ratio G5 Terc–/– interphase fluorescence/wild-type average fluorescence). A higher number of cardiac myocytes show low telomere fluorescence ratio values in the aged G5 Terc–/– mice compared with the younger animals. The difference is statistically significant (P < 0.0001).