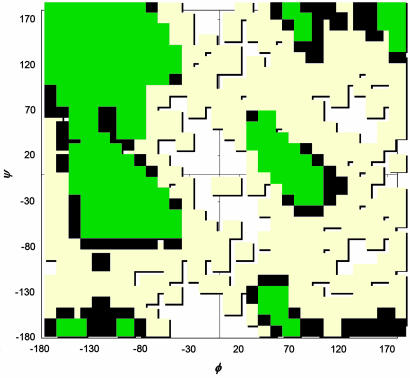
Fig. 1.
Ramachandran φ–ψ plot. Regions of the φ–ψ space are divided into “core” favorable regions (green), allowed regions (blue), unfavored regions (tan), and disallowed regions (white). Overall, the plot shows four conformational clusters with their centers around the (φ,ψ) values of (−100, −30), (−100, 120), (60, 0), and (60, 180) degrees.

