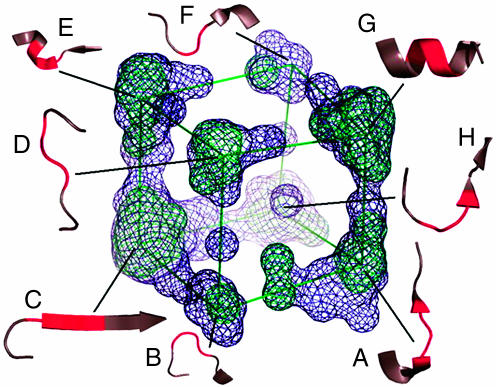
Fig. 2.
3D map of conformational space for the peptides with three φ–ψ values and representative conformations. To extract and visualize the major features of a HOPP map, the highest three eigen values of the HOPP space are plotted in this map. The multidimensional scaling projections are represented as wire mesh surfaces at two colored contour (σ) levels into a medium- and high-density region (blue, 2σ; green, 3σ). Each conformation (in red) is indicated in the context of the local structure in which the sample conformation was found in crystal structures. Annotated conformations are as follows: A, turn type II; B, turn type II; C, β-extended; D, turn type I; E, helical N-cap; F, turn type II; G, helix; H, turn type I. For more information see ref. 5.

