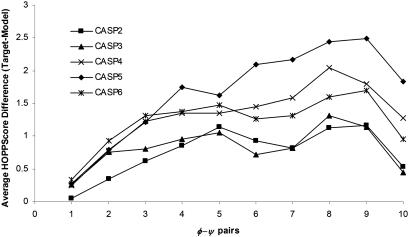
Fig. 4.
Comparing the scores of CASP models to their high-resolution targets. For each fragment size from 1 to 10 φ–ψ pairs both the predicted model and the corresponding experimental target (for high-resolution structures ≤ 1.8 Å) HOPPscore values are calculated and the difference between scores is tallied. Average scores for each of the CASP trials are displayed. Variable grid size = 12°, and resolution set = 1.8 Å.

