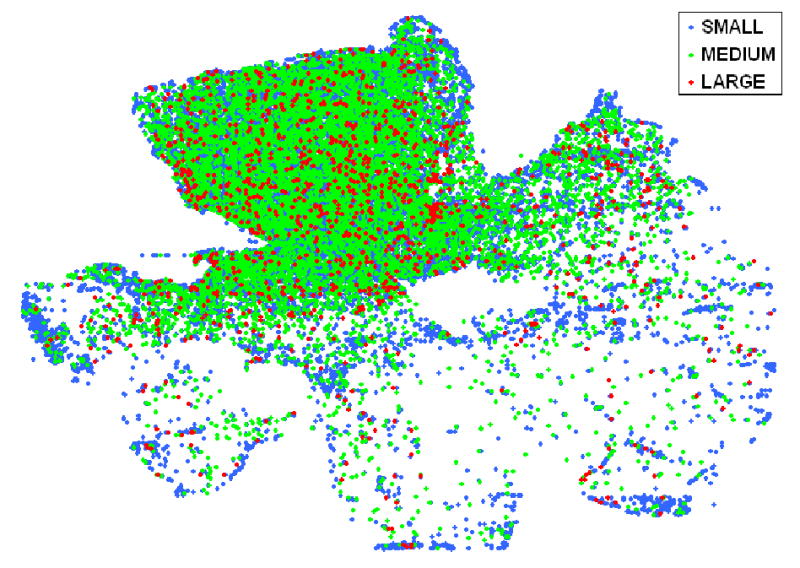
Figure 11.

Size distribution map in a Wistar retina with partial RGC loss due to high IOP. RGCs are grouped as small (equivalent diameter less than 15μm), medium (equivalent diameter between 15 and 23.5μm) and large (equivalent diameter more than 23.5μm).
