
Figure 3.
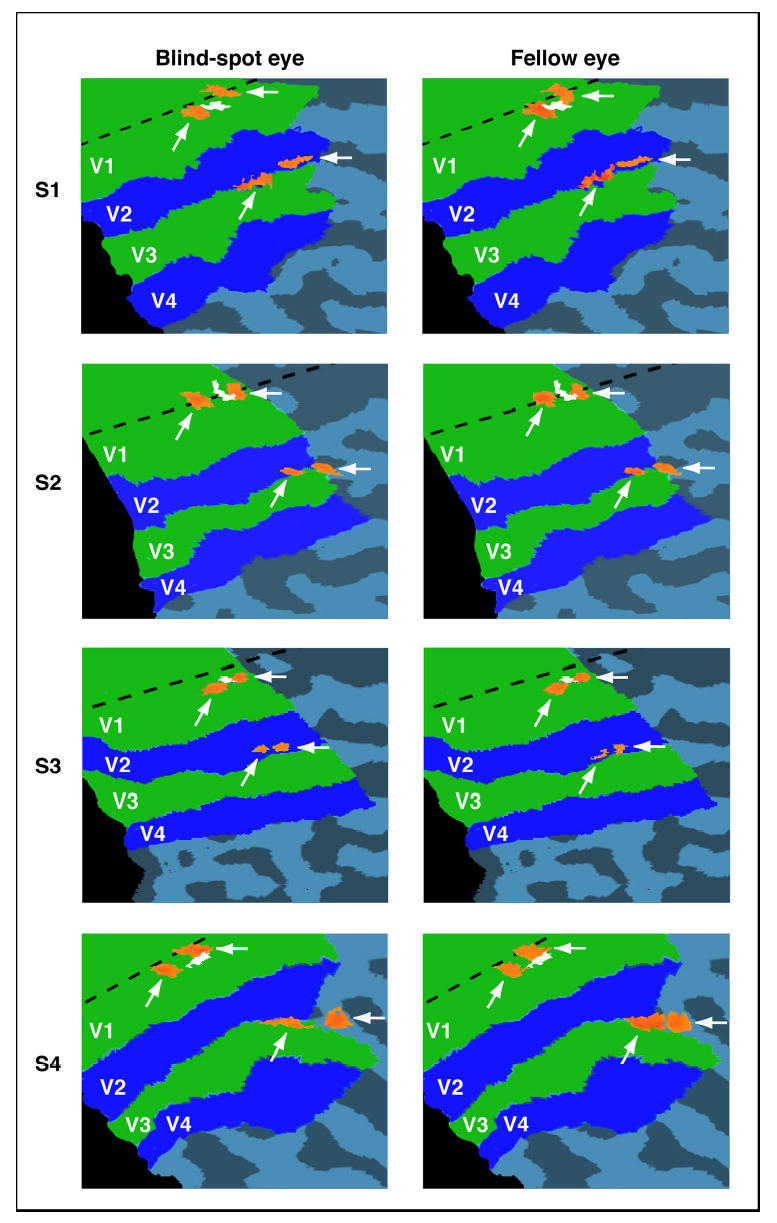
Cortical activation maps evoked by stimulation of the blind-spot eye (left column) and stimulation of the fellow eye (right column), shown on flat maps for all four subjects. Dashed lines indicate the horizontal meridian, and white regions near the horizontal meridian correspond to the V1 representation of the blind spot. Arrows point to activations evoked by the left and right wedges in early visual areas V1 and V2/V3. Statistical thresholds of these activations were adjusted separately to identify regions of peak activity of about 50 mm3 in volume (see Methods). Activations for each eye occurred in very similar locations of V1 and V2/V3, suggesting that the cortical representation of space around the blind spot is very similar for the two eyes.