
Figure 4.
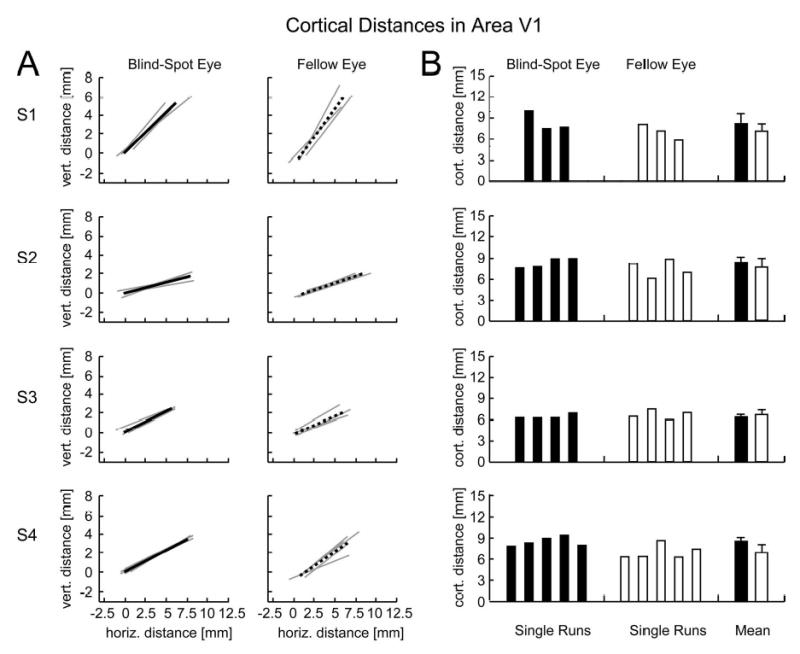
Cortical distances between activations in area V1 for all subjects. A: The endpoints of each line correspond to the centroids of activations for the blind-spot eye (left) and fellow eye (right), with line length indicating the cortical separation between activations to the left wedge and right wedge. Thin gray lines correspond to single experimental runs; thick lines show positions of peak activity after averaging across all experimental runs. All lines are plotted relative to the position of the centroid of mean activation evoked by the left wedge during stimulation of the blind-spot eye, with vertical and horizontal positions calculated relative to this anchor position for each flatmap image shown in Fig. 3. Activation positions and cortical distance measures are very similar for the blind-spot eye and fellow eye. B: Magnitude of cortical distances for single experimental runs and mean cortical distances across runs for the blind-spot eye (black bars) and fellow eye (white bars). Error bars, which represent standard deviations across single experimental runs, reveal an average error of 1 mm, indicating the high accuracy and reliability of our distance measures. Cortical distance measures for the blind-spot eye and fellow eye did not reliably differ in subjects 1-3. Subject 4 showed larger distance measures for the blind-spot eye than for the fellow eye, contrary to the predictions of the passive remapping hypothesis.