
Figure 7.
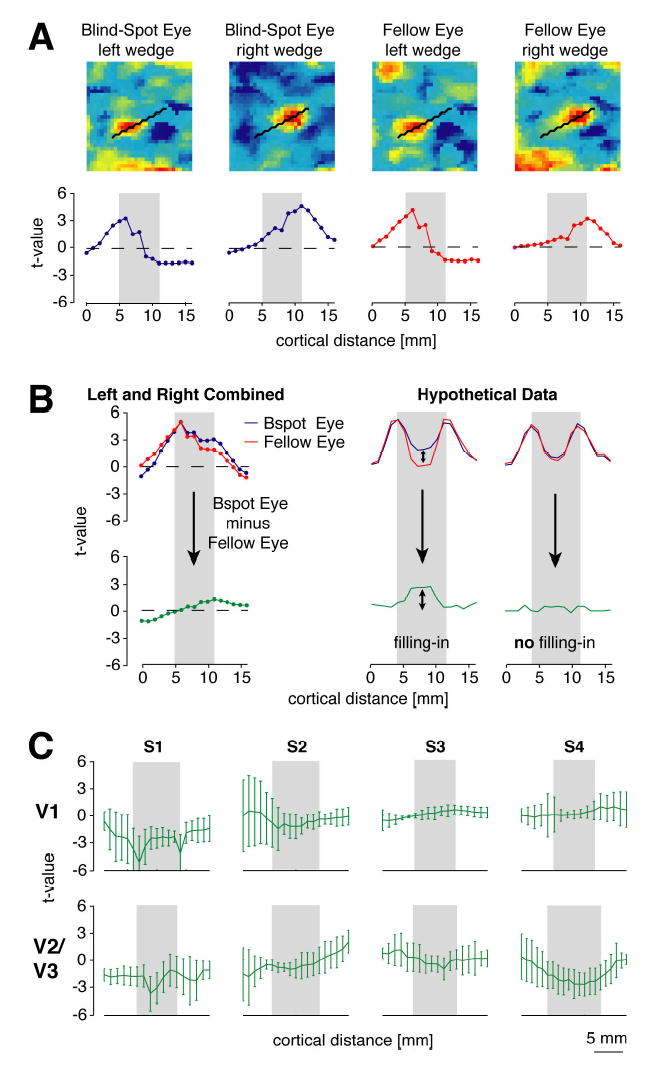
Spatial distribution of activity in V1 and V2/V3 during stimulation of the blind-spot eye (blue curves) and fellow eye (red curves). A: Above, example of V1 activation maps for left and right wedges presented to either eye of subject 3 on a single fMRI run (color coding: yellow-red, positive t-values; green-blue, negative t-values). Below, spatial distribution of activity across cortex for each stimulus condition on a single run. Activity levels were obtained from voxels positioned along a line connecting peak responses for all left wedge and right wedge runs (black line plotted on flatmaps). Within the two peaks of activity evoked by the left and right wedge (gray inset region) lies the cortical representation of the blind spot. T-values, which represent the signal-to-noise level of the response of each voxel, are plotted for all analyses. B: Sum of activity for left and right wedges, plotted by eye for two single runs of subject 3. Green curve shows the difference in summed activity for blind-spot eye (blue) minus fellow eye (red) conditions. If passive remapping occurs at the blind spot, then the resulting difference curve should be more positive in the cortical representation of the blind spot (which lies within the gray inset region) than outside of the blind-spot region (Figure 7B, hypothetical data). C: Difference curves (blind-spot eye minus fellow eye) for all four subjects in areas V1 and V2/V3. Error bars depict standard deviation of response differences across paired experimental runs. Contrary to the predictions of passive remapping, there was no evidence of greater activity in the blind-spot representation, relative to surrounding regions, in area V1 or V2/V3 of any subject.