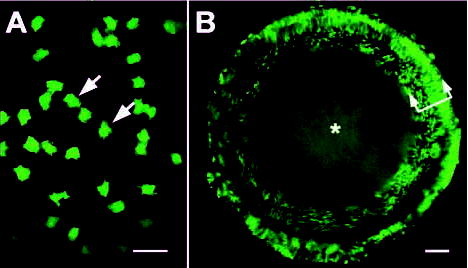
Fig. 1.

Variegated expression of a GFP transgene in the lens of hemizygous TgN(GFPU)5Nagy mice. (A) En face confocal view of the lens epithelium. Individual GFP-expressing cells are evident (arrows). Nonexpressing cells occupy the spaces between the fluorescent cells. The proportion of GFP-expressing epithelial cells varied from 20–50%. (B) Confocal image of a living, intact, P1 lens imaged in the equatorial plane. Note the variegated GFP expression pattern in the outer cortex (arrows) and the reduced, but uniform, fluorescence in the lens core (*). Bars, A, 25 μm; B, 100 μm.
