Fig. 3.

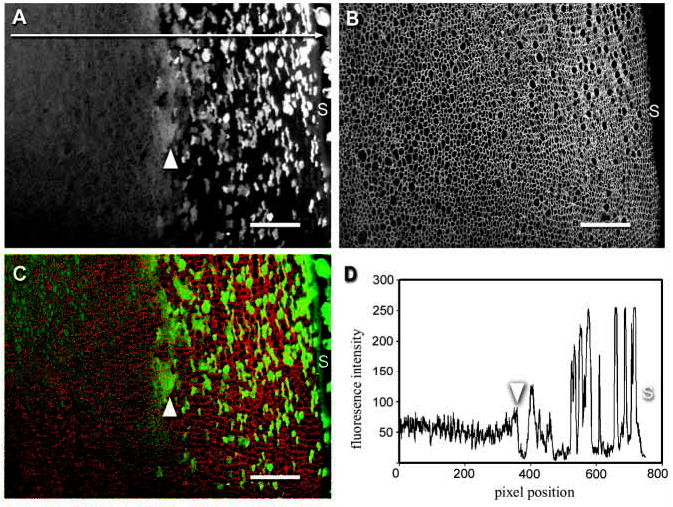
Covisualization of GFP fluorescence and AQP0 immunofluorescence in a fixed, equatorial lens slice from a P7 TgN(GFPU)5Nagy mouse. (A) GFP expression in fiber cells in the outer cortex. Near the lens surface (S), GFP-expressing fiber cells are interspersed with nonexpressing cells. Approximately 150 μm below the surface there is a transition (arrowhead) to a diffuse pattern of fluorescence in which all cells are weakly fluorescent. (B) Immunofluorescence detection of AQP0, an intrinsic lens membrane protein, highlights the membrane organization in this region of the lens. In equatorial sections lens fiber cells are seen in cross section. (C) Merged image of endogenous GFP fluorescence (green) and AQP0 immunofluorescence (red). Note that the transition (arrowhead) from the mosaic GFP fluorescence pattern that characterizes the superficial cells to the diffuse distribution in the inner cells is not associated with a marked change in the cross-sectional profiles of the fibers. (D) Pixel intensity histogram of GFP fluorescence collected along the line indicated in A. The average fluorescence intensity does not differ markedly in cells located either side of the transition region (arrowhead). In this example, at pixel positions >385, the average fluorescence intensity was 70.9±71.0 At pixel positions <385, the average intensity was 52.5±14.9. Bars in A, B, C, 50 μm.
