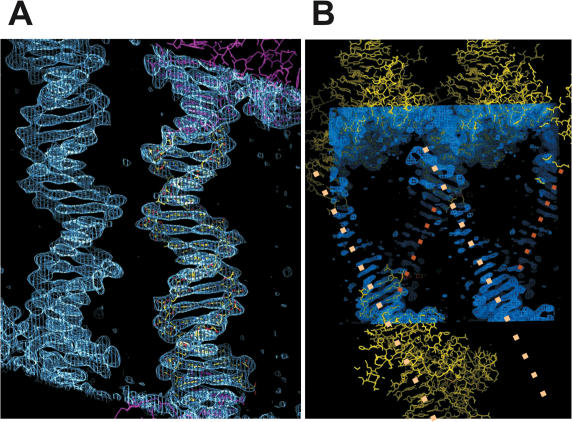
Figure 3.
2F0-Fc electron density distribution contoured at 1.2 σ level; view perpendicular to crystallographic b, c planes with the c-axes vertically oriented. (A) Parallel free DNAs (yellow) in [Δ19ω2]2-(→→)≡(→→) are at ∼5 Å shortest distance to each other and stack at both ends with Δ19ω2-bound DNAs (magenta). Free DNA is not involved in any further crystal contacts. (B) Discontinous electron density for free DNA in [Δ19ω2]2-(→←)≡(→←). Modeled complexes of [Δ19ω2]2-(→←) and modeled bases of free DNA (see Figure 1B) in yellow. The central parts of free DNA marked by dotted lines (4 to 15 bp, Figure 1B) could not be modeled due to patchy electron density. The shortest distance between free DNAs is ∼8 Å and they are at an angle of ∼40°.

