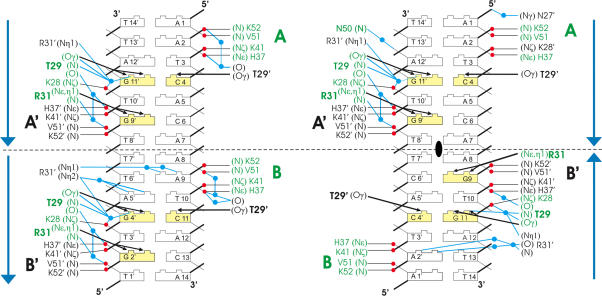
Figure 4.
Schematic representation of interactions between Δ19ω2 and DNA in [Δ19ω2]2-(→→) (left) and [Δ19ω2]2-(→←) (right). The orientation of heptads is indicated by blue arrows and palindromic symmetry by the black ellipse. Yellow bases specifically interact with Δ19ω2. Residues labeled green for Δ19ω A/B and black for Δ19ω A′/B′. Hydrogen bonds to phosphate oxygens (red) in thin black lines, specific hydrogen bonds to bases in the major groove in black arrows, blue lines indicate water (blue dots) mediated hydrogen bonds. K28 (K28′) and Arg31 (Arg31′) interact differently in subunits A/B and A′/B′.

