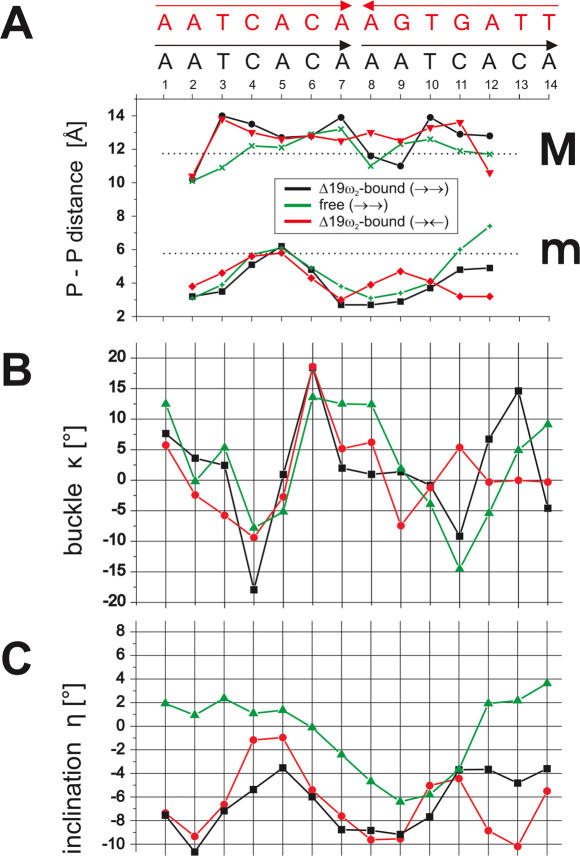
Figure 7.
Comparison of operator DNA free and in complex with Δ19ω2. (A) Minor (m) and major (M) groove widths along the central 11 bp of each operator, as measured by shortest P-P distances (less two phosphate group radii, 5.8 Å) indicated by horizontal dotted black lines for ideal B-DNA (24), 5.7 Å and 11.7 Å, respectively, Note minor groove narrowing in the 7AAAT10 tract of in Δ19ω2-bound and free (→→) DNA and reduced narrowing in 7AAGT10 tract of (Δ19ω2)2-(→←). (B) Base pair buckle κ (°) and (C) inclination angles η (°) of each operator.

