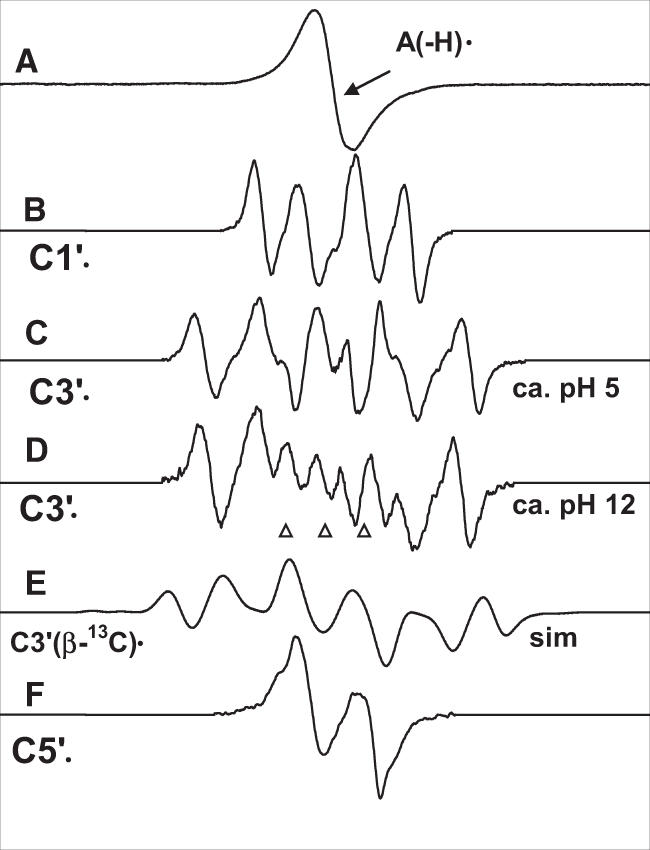
Figure 1.

Benchmark spectra used for computer analysis. (A) A(-H)•, produced from dAdo. (B) C1′•, produced from G•+ in 3′-dGMP (4). (C) C3′•, produced from A(-H)• in 5′-dAMP at native pH (∼5) of 7 M LiCl glass. (D) C3′•, produced from A(-H)• in dAdo at pH ∼12. (E) Simulated spectrum for C3′• using three β-hydrogen couplings and a single β-13C isotropic hyperfine coupling (see text). (F) C5′•, produced from A(-H)• in 3′-dAMP (for details see Table 1). pHs are approximate. The three reference markers in this and in subsequent figures are Fremy's salt resonances (The central marker is at g = 2.0056 and each of three markers is separated from the adjacent one by 13.09 G).
