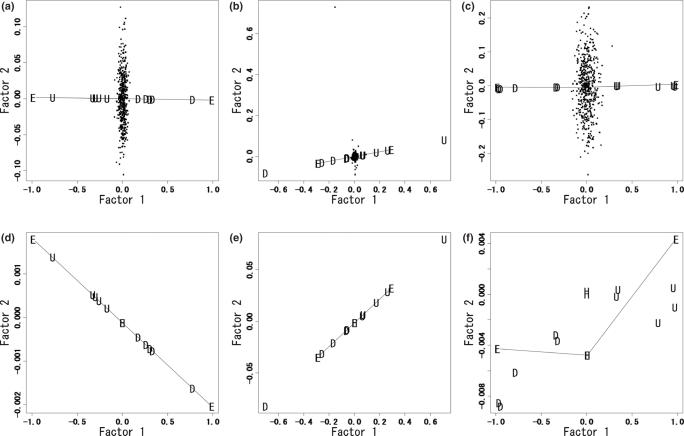
Figure 1.
CA with three indices. Factor1 and Factor2, the first two axes obtained from CA, respectively; U, genes up-regulated (U1 to U5) in phenotype A samples; D, down-regulated genes (D1 to D5) in phenotype A samples; H, housekeeping genes (HK1 to HK3); E, ExtraGenes (ExtraGene1 to ExtraGene3); dots, unrelated genes (Unrelated1 to Unrelated500). (a) CA with the new index. (b) CA with an additively shifted logarithmic ratio. (c) CA with a rank index. (d–f) Plots of only U, D, H and E for (a–c), respectively.

