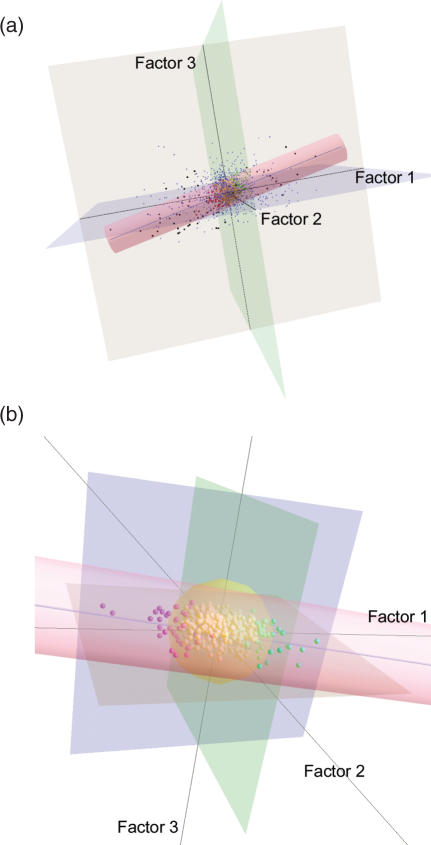
Figure 2.
CA plots for 24 024 genes in the first 3D subspace. Factor1, Factor2 and Factor3 show the first three axes obtained from CA, respectively. (a) CA plot for all of the analyzed 24 024 genes. The cylinder indicates the UDR. The blue line inside the UDR is the UDL. The 23 480 genes (small blue dots) unrelated to cancer are outside the UDR. The black dots out of the UDR correspond to 70 candidate genes identified by van't Veer et al. (21). (b) CA plot for the 544 genes inside the UDR. The 456 yellow spheres indicate significant housekeeping genes. Of the remaining 88 genes, the 43 red and 45 green spheres indicate statistically significant up- and down-regulated genes, respectively.

