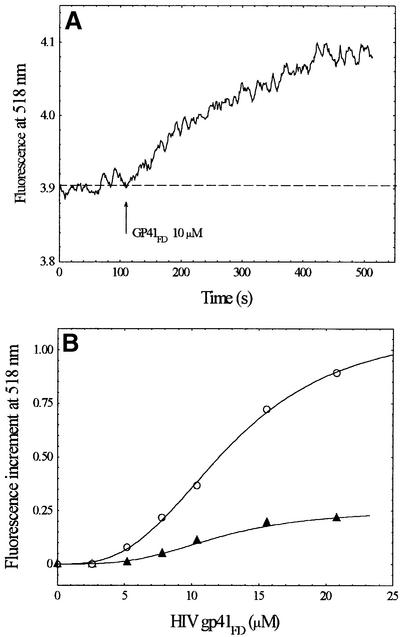
Fig. 3. (A) Time course of the interaction of gp41FD with Jurkat cells as revealed by fluorescence of FPE-labelled membranes. (B) Amplitude of the fluorescence variation as a function of peptide concentration following normalization by background subtraction in the absence (open circles) and presence (closed triangles) of 700 nM IL-8. Data were fitted to equation 1 (see Materials and methods). Cell concentration was 2 × 10⁴ cells/ml. Other experimental conditions as in Figure 1.

An official website of the United States government
Here's how you know
Official websites use .gov
A
.gov website belongs to an official
government organization in the United States.
Secure .gov websites use HTTPS
A lock (
) or https:// means you've safely
connected to the .gov website. Share sensitive
information only on official, secure websites.
