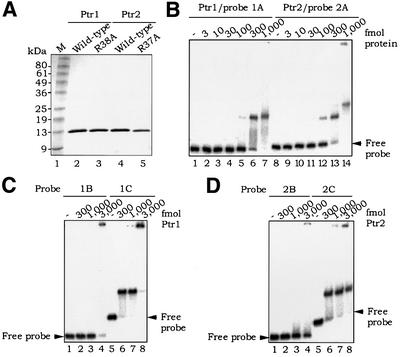
Fig. 2. Specific binding by Ptr1 and Ptr2 to their promoter regions. (A) SDS–PAGE analysis of recombinant wild-type and alanine substitution mutant Ptr1 and Ptr2 proteins (∼2 µg each), as indicated above each lane. (B) EMSA analysis of Ptr1 and Ptr2 binding to the promoter probes 1A (–125 to +118, relative to the putative Ptr1 promoter start site of transcription) (lanes 1–7) and 2A (Ptr2 promoter region –201 to +53) (lanes 8–14), respectively. Approximately 10 fmol of end-labeled probe were incubated in the absence (lanes 1 and 8) or presence of increasing concentrations of either protein (amounts indicated above each lane) for 20 min at 65°C, and subjected to an EMSA (as described in Materials and methods). The unbound DNA is indicated by an arrow. Protein quantities in this panel and throughout are stated in terms of the monomer. (C) EMSA analysis of Ptr1 binding to promoter probes 1B (–125 to –33) (lanes 1–4) and 1C (–34 to +118) (lanes 5–8). (D) Analysis of Ptr2 binding to promoter probes 2B (–201 to –104) (lanes 1–4) and 2C (–88 to +53) (lanes 5–8).

An official website of the United States government
Here's how you know
Official websites use .gov
A
.gov website belongs to an official
government organization in the United States.
Secure .gov websites use HTTPS
A lock (
) or https:// means you've safely
connected to the .gov website. Share sensitive
information only on official, secure websites.
