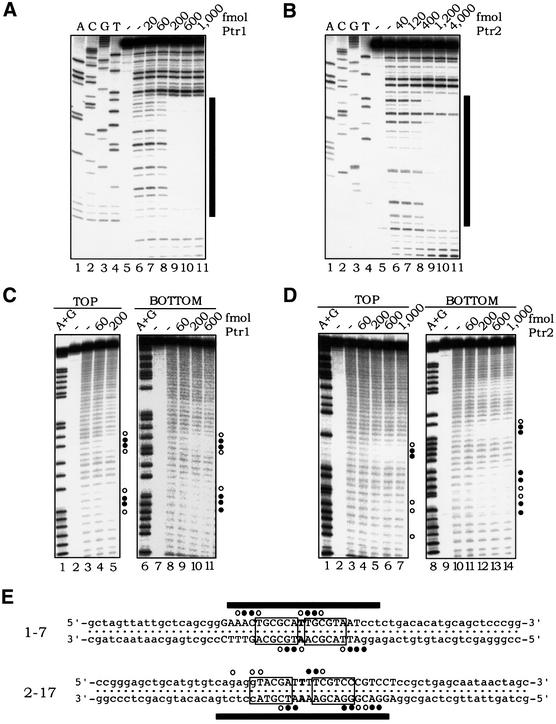
Fig. 5. Footprinting analyses of Ptr1– and Ptr2–DNA complexes. DNA sites 1-7 (A) and 2-17 (B) were incubated in the absence (lane 6, in each panel) or presence of increasing concentrations of Ptr1 and Ptr2 (lanes 7–11), respectively, and subjected to DNase I treatment. Lanes 1–4 of each panel show a dideoxynucleotide sequencing ladder of the analyzed DNA strand. The bars on the right mark the extent of the footprint, whose sequence is specified in (E). (C) Hydroxyl radical footprinting of Ptr1–DNA complexes. 1-7 DNA, 5′-end-labeled on either the top or bottom strand, was incubated in the absence (lanes 3 and 8) or presence of increasing amounts of Ptr1 (indicated above each of lanes 4–5 and 9–11) and subjected to hydroxyl radical cleavage for 30 s at 65°C. On the right of each panel, the positions of strong protection by Ptr1 are indicated by closed circles, and those exhibiting weaker protection are indicated by open circles. Lanes 1 and 6 show A+G chemical sequencing ladders. (D) Hydroxyl radical footprinting of Ptr2–DNA complexes. Ptr2 binding to 2-17 DNA probes, 5′-end-labeled on either the top or bottom strand, was analyzed as described above for Ptr1. (E) Summary of the DNase I and hydroxyl radical protection patterns. The complete nucleotide sequences of DNAs 1-7 and 2-17 are shown, with the consensus half-site hexamers boxed. On each probe, the region that is protected from DNase I cleavage upon binding to its cognate protein is indicated by black bars. The positions of protection against hydroxyl radical cleavage are indicated by circles, as above.

An official website of the United States government
Here's how you know
Official websites use .gov
A
.gov website belongs to an official
government organization in the United States.
Secure .gov websites use HTTPS
A lock (
) or https:// means you've safely
connected to the .gov website. Share sensitive
information only on official, secure websites.
