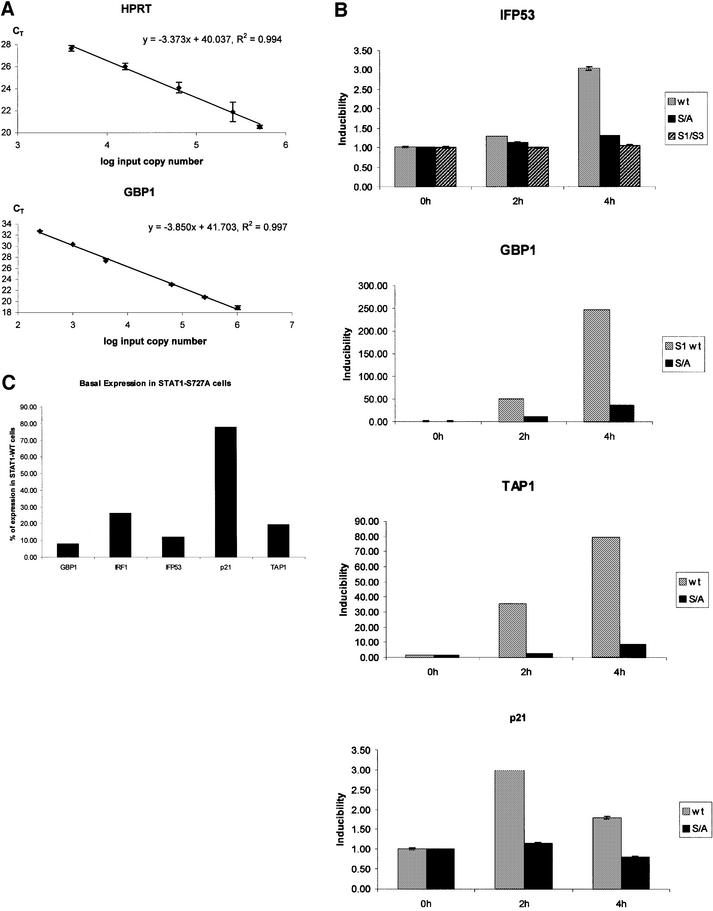
Fig. 4. Real-time PCR analysis of reverse-transcribed IFN-γ-induced mRNAs. (A) Standard curves for HPRT and GBP1. The input cDNA templates (log input copy number) are plotted against the CT values. The HPRT standard curve was used to normalize the target gene expression for differences in the amount of cDNA added to each reaction. (B) mRNA inducibility of the indicated genes determined in fibroblasts reconstituted with STAT1-WT- (light gray), STAT1-S727A- (dark gray) or STAT1–STAT3 chimera-reconstituted fibroblasts (hatched, IFP53 only). mRNA quantities were determined in samples from untreated cells or after 2 and 4 h of IFN-γ treatment. Inducibility was calculated as the difference of HPRT-normalized CT values in control and IFN-γ-treated cells. (C) Quantitative comparison of the basal expression levels of the indicated genes in STAT1-WT- and STAT1-S727A-reconstituted cells. The numbers of mRNA molecules in each sample were calculated from HPRT-normalized standard curves and the percentage reduction caused by the S727A mutation was calculated.

An official website of the United States government
Here's how you know
Official websites use .gov
A
.gov website belongs to an official
government organization in the United States.
Secure .gov websites use HTTPS
A lock (
) or https:// means you've safely
connected to the .gov website. Share sensitive
information only on official, secure websites.
