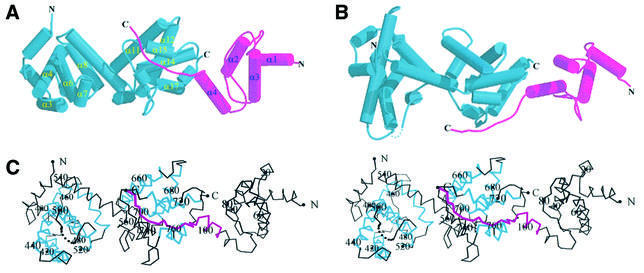
Fig. 1. (A) Schematic drawing of the Rb pocket–SV40 large T antigen complex. Large T antigen is shown in magenta, Rb pocket is shown in blue. The cyclin boxes in Rb pocket and the helices in T antigen are labeled. (B) View of the complex looking down the vertical axis of (A). Both parts were drawn using the programs MOLSCRIPT (Kraulis, 1991) and RASTER3D (Merrit and Murphy, 1994). (C) Stereo view of the Cα trace of the Rb pocket–large T antigen complex in the same orientation as in (A). Every 20th residue is numbered and its Cα atom highlighted as a circle. The regions in large T antigen that contact with Rb are shown in magenta. Cyclin boxes are shown in blue.

An official website of the United States government
Here's how you know
Official websites use .gov
A
.gov website belongs to an official
government organization in the United States.
Secure .gov websites use HTTPS
A lock (
) or https:// means you've safely
connected to the .gov website. Share sensitive
information only on official, secure websites.
