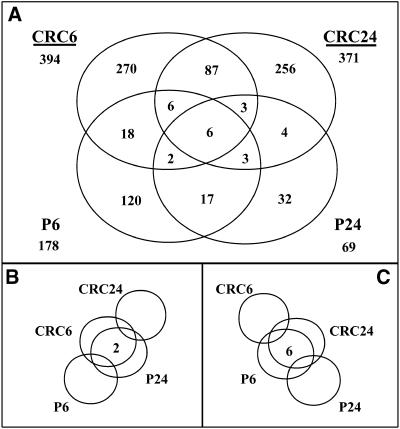
Figure 7.
A Venn Diagram of Shared and Specific Differentially Expressed cDNA Fragments for All Treatments Analyzed.
(A) The numbers of unique cDNA fragments for the majority of comparisons are shown. The cDNA fragments are either induced or repressed, with a more than twofold difference detected between 6 or 24 hr and 0 hr after initiating treatment, in the cell lines indicated. These fragments are either shared or unique to particular treatments. The values shown under each treatment name are the total number of unique cDNA fragments that showed differential expression for that treatment.
(B) The number of cDNA fragments showing differences at 6 hr after treatment for CRC-expressing cells and at 24 hr after treatment for P-expressing cells versus their corresponding 0-hr values.
(C) The number of cDNA fragments showing differences at 24 hr after treatment for CRC-expressing cells and at 6 hr after treatment for P-expressing cells versus their corresponding 0-hr values. The number of cDNA fragments with responses in agreement with that of the control BMS line was excluded.

