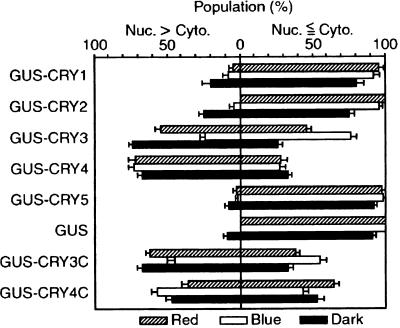
Figure 7.
Intracellular Distribution of GUS–CRY Fusion Proteins under Different Light Conditions.
Distribution patterns of GUS activities in individual transformed cells were classified into two groups: (1) nuclear enrichment of GUS activity was seen (nucleus [Nuc.] > cytoplasm [Cyto.]) or (2) nuclear enrichment of GUS activity was not seen (Nuc. ⩽ Cyto.). These cells expressed each GUS–CRY fusion protein under red light (striped bars), blue light (open bars), or in the dark (black bars). From protonemal cells prepared under the same experimental conditions as in Figure 6, we randomly selected cells that showed GUS activities. The first group (Nuc. > Cyto.) contained cells that showed clear nuclear enrichment with various degrees of cytoplasmic GUS staining; and the second group (Nuc. ⩽ Cyto.) contained cells that showed nuclear staining indistinguishable from or less than cytoplasmic staining. The data were obtained from between three and seven independent experiments. In total, we examined 45, 119, and 104 cells (red light, blue light, and dark treatment, respectively) for GUS–CRY1; 30, 76, and 117 cells for GUS–CRY2; 117, 129, and 114 cells for GUS–CRY3; 120, 120, and 124 cells for GUS–CRY4; 105, 139, and 139 cells for GUS–CRY5; 144, 113, and 130 cells for GUS; 120, 136, and 111 cells for GUS–CRY3C; and 141, 128, and 119 cells for GUS–CRY4C. For each experiment, we calculated the percentage of population of each group, dividing the number of cells belonging to each group by the total number of cells examined in that experiment. The bars show the average percentages of populations derived from all experiments. Standard errors of the mean are indicated.

