
Figure 3.
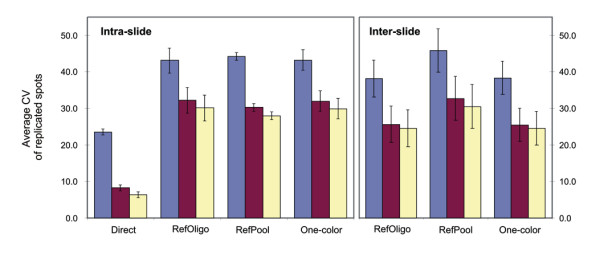
Precision of direct versus reconstructed ratios as determined by the average coefficient of variance (CV) of intra- and inter-slide replicates. Average CV of expression ratios derived from intra-slide spot replicates (left panel) or inter-slides (right panel) obtained in direct hybridizations or in indirect hybridizations (RefOligo, RefPool, One-Color). CVs were calculated using all ratios (blue bars), ratios calculated from spots that were one (red bars) or two (yellow bars) standard deviations above the local background. Standard errors from pair-wise comparisons of three tissues (Prostate vs. Breast, Prostate vs. Kidney or Breast vs. Kidney) are shown.