
Figure 6.
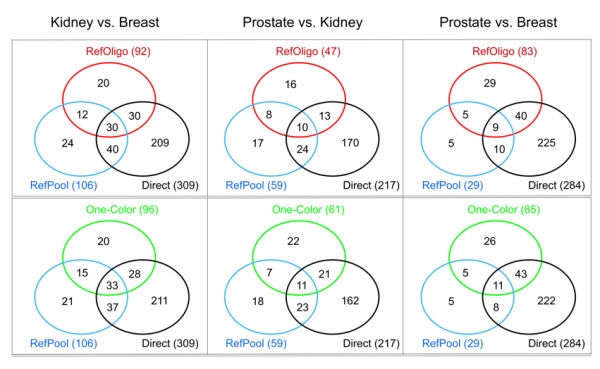
Comparison of genes identified as differentially expressed in direct and reconstructed ratios. Each of the three pair-wise tissue comparisons is shown at the left, center or right panels as indicated at the top of the figure. Genes identified as differentially expressed by direct and indirect methods were selected based on 95 % credibility intervals (see Methods). Upper panels: genes identified by the RefOligo analysis are compared to those identified in RefPool and Direct analyses, and displayed as unions and intersections using Venn diagrams. Lower panels: genes identified by the One-Color analysis are compared. The total number of genes identified by each method is indicated in parenthesis.