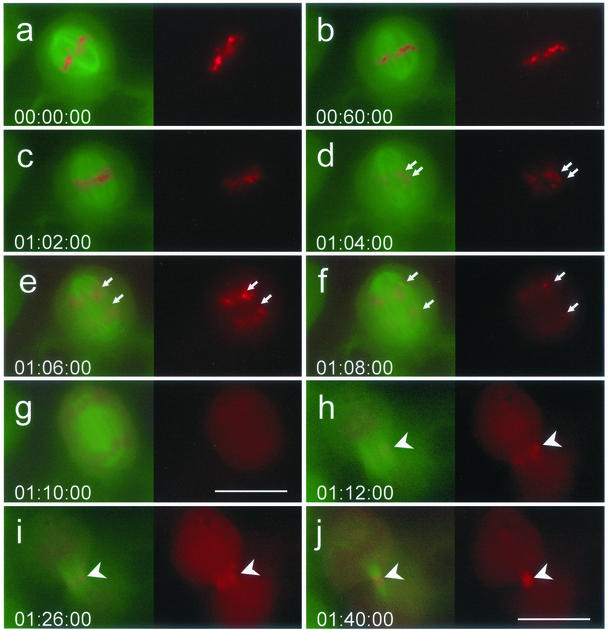
Figure 4.
Release of survivinDsRed from chromosomes, its equal distribution in the cytoplasm and reaggregation at the telophase disk. Time-lapse video imaging analysis of a HeLa cell line stably expressing survivinDsRed and EGFP-α-tubulin. a and b, metaphase; c–g, anaphase; and h–j, telophase. Exposure time in h–j was three times longer than in a–g. Arrows mark the progression of chromatide separation during mitosis. Arrowheads mark the cleavage furrow. Bars (a–g), 20 μm; h–j, 30 μm. Time is indicated as hours:minutes:seconds.

