Figure 4.
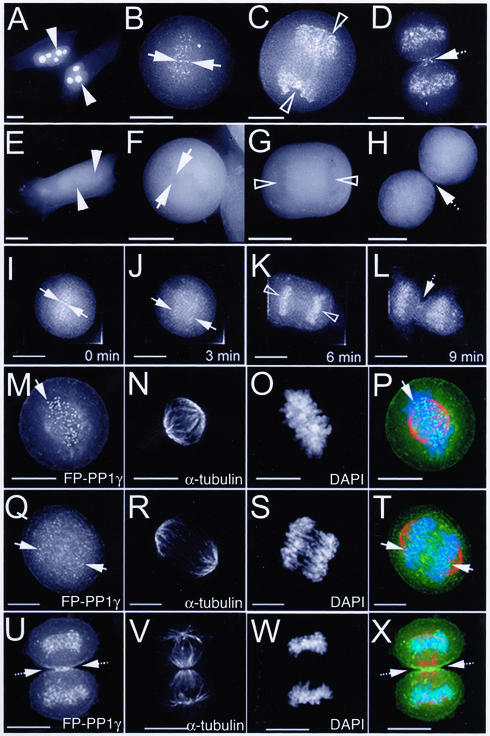
Dynamic distribution of FP-PP1γ throughout cell division. Live HeLaEYFP-PP1γ (A–D) and HeLaEGFP (E–H) cells were imaged using a Deltavision restoration microscope. All images shown here are 2D maximum projections of Z-series data. In interphase cells (A and E), nucleoli are marked by arrowheads. Regions of condensed chromatin are marked by arrows in metaphase cells (B, F) and by open arrowheads in anaphase cells (C and G). The spindle midzone region is marked by a hashed arrow in telophase cells (D and H). Time-lapse imaging of a single mitotic HeLaEYFP-PP1γ cell confirms these patterns and reveals the short time period over which they occur (I–L). Mitotic HeLaEYFP-PP1γ cells were also fixed and stained with anti–α-tubulin to mark spindles (N, R, and V) and DAPI to mark chromosomes (O, S, and W). The FP-PP1γ signal (M, Q, and U) is shown for cells in metaphase (M–P), early anaphase (Q–T), and telophase (U–X). All three patterns are shown merged in P, T and X. Scale bar, 10 μM.

