Figure 6.
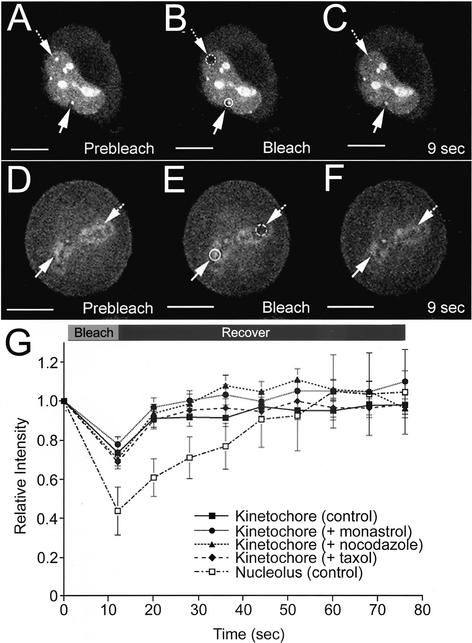
Nucleolar and kinetochore pools of FP-PP1γ show rapid turnover rates. Live HeLaEYFP-PP1γ cells were subjected to FRAP experiments in which a specific pool of EYFP-PP1γ was photobleached and recovery of fluorescent signal monitored over time. For the interphase HeLaEYFP-PP1γ cell shown in A–C, a nucleolus (hashed circle/arrow) was photobleached, whereas a nonbleached nucleolus (circle/arrow) was monitored for comparison. The signal recovered by ∼50% in 9 s (C). The experiment was repeated three times, and a plot of signal recovery over time for a bleached nucleolus normalized to a nonbleached nucleolus in the same cell is shown (G; □), with each time point presented as mean relative intensity ± SD. For the metaphase HeLaEYFP-PP1γ cell shown in D–F, a kinetochore region (hashed circle/arrow) was photobleached, whereas a nonbleached kinetochore region (circle/arrow) was monitored for comparison. The signal showed an apparent full recovery by 9 s (F). The experiment was repeated five times, and a plot of signal recovery over time for a bleached kinetochore normalized to a nonbleached kinetochore in the same cell is shown (G; ▪), with each time point presented as mean relative intensity ± SD. Similar recovery kinetics were observed for this intracellular pool when HeLaEYFP-PP1γ cells were treated with monastrol to inhibit the Eg5 mitotic kinesin (G; ●, n = 3), with nocodazole to disrupt microtubules (G; ▴, n = 4) or with taxol to release tension on kinetochores (G; ♦, n = 4). Scale bars, 10 μM.

